“Efficiently measuring and mapping green herbage mass using remote sensing devices offers substantial potential benefits for improved management of grazed pastures over space and time. Several techniques and instruments have been developed for estimating herbage mass, however, they face similar limitations in terms of their ability to distinguish green and senescent material and their use over large areas. In this study we explore the application of an active, near infrared and red reflectance sensor to quantify and map pasture herbage mass using a range of derived spectral indices. The Soil Adjusted Vegetation Index offered the best correlation with green dry matter (GDM), with a root mean square error of prediction of 288 kg/ha. The calibrated sensor was integrated with a Global Positioning System on a 4-wheel motor bike to map green herbage mass. An evaluation of representative, truncated transects indicated the potential to conduct rapid assessments of the GDM in a paddock, without the need for full paddock surveys.” (Trotter et al, 2010)
The orthomosaic images below are of perennial pasture in the Hunter Valley region. The orthomosaics were created with a Sequoia multispectral camera and an eBee Plus RTK drone.
Visual Indexes
What is a spectral index?
A spectral index is a mathematical equation that is applied on the various spectral bands of an image per pixel.
Each pixel is described by n numbers, where n is the number of spectral bands. A spectral index is calculated using some of these values (depends on the specific index) in a mathematical formula.
The most common mathematical formulas that are used is the normalized difference:
(Bx – By)/(Bx + By)
In practical terms, it is the difference between two selected bands normalized by their sum. This type of calculus is very useful to minimize (as much as possible) the effects of illumination (shadows in mountainous regions, cloud shadows, etc) and enhance spectral features that are not visible initially. Of course, there numerous of different equations that can be applied on the spectral to produce a spectral index.
The Normalized Difference Vegetation Index (NDVI) enhances the vegetation and more specifically the healthy vegetation. The spectral response of vegetation (crops, forests, bushes, etc) shows a huge increase of the reflection percentage from 700nm to 1000nm. The main ingredient for this increase in reflection is the chlorophyll mostly located in the plant leafs. On the contrary, land (soil, urban structures) without vegetation, according to the type of surface, has a continuous linear behaviour. Beside the determination between of the vegetation and other objects it allows to detect the vitality of the vegetation.
The NDVI is calculated using the following equation:
NDVI = (Bnear_IR – Bred) / (Bnear_IR + Bred)
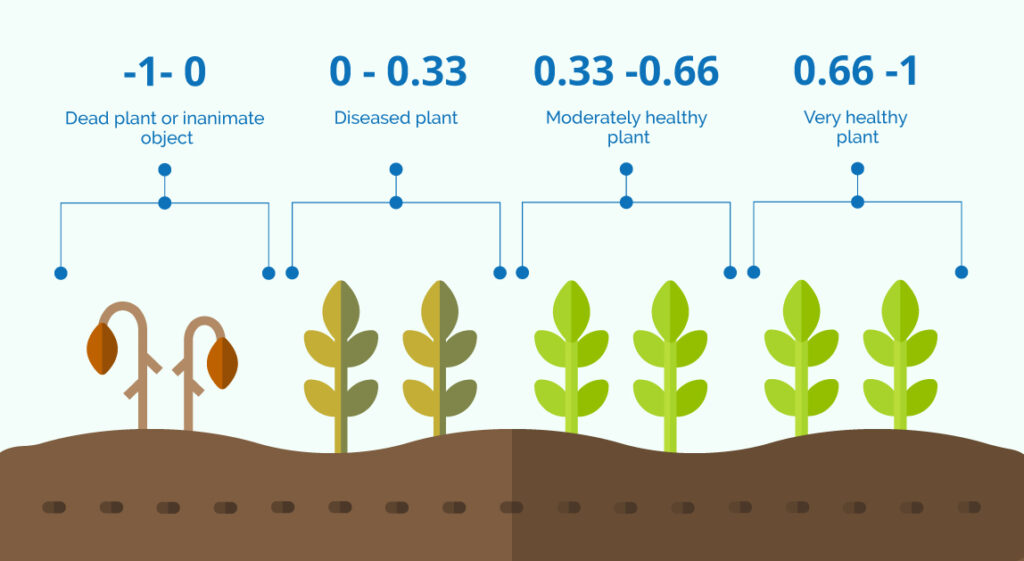
where Bnear_Ir is the value of the pixel at the near infrared band and Bred is the value of the pixel located at the red part of the spectrum. The value range of an NDVI is -1 to 1. Negative values of NDVI (values approaching -1) correspond to water. Values close to zero (-0.1 to 0.1) generally correspond to barren areas of rock, sand, or snow. Values greater than 0.2 are vegetation (the higher the value the healthier/denser the vegetation).
SAVI Index and Green Dry Matter Estimates
SAVI or Soil Adjusted Vegetation Index is a spectral index introduced by Huete in 1988.
SAVI attempts to be a hybrid between the ratio-based indices and the perpendicular indices. The reasoning behind this index acknowledges that the isovegetation lines are not parallel, and that they do not all converge at a single point.
SAVI can be calculated based on the following equation:
SAVI = (1 + L) * (Bnir – Bred) / (Bnir + Bred + L)
where L is a correction factor which ranges from 0 for very high vegetation cover to 1 for very low vegetation cover. The most typically used value is 0.5 which is for intermediate vegetation cover. Bnir and Bred are the band values of the nir and red band
It may be possible to directly transfer the results of Trotter et al to calculate GDM (Green dry matter), but with some ground truthing applied. This would yield valid quantitative data of Green Dry matter.
We did some ground truthing here, comparing SAVI against estimated DM estimated by field based pasture via pasture rules as per https://mbfp.mla.com.au/pasture-growth/tool-27-field-based-pasture-measurements/
Using a small number of these comparisons, we checked these against the Trotter et al, calculation and yielded a good correlation with ruler based estimates for dense to lightly grazed pasture. Actual DM measurements would be ideal, but we were simply doing a quick validation on what is some very dense pasture with high vegetation.
Average pasture GDM was estimated to be about 3000 kg/ha, corresponding with a SAVI of 0.110. Using a threshold adjustment, the same Multispectral image was adjusted to show SAVI of 0.110 and higher as green. Thus, those pasture areas yielding aprox 3000 kg/ha and above are shown in green in the below image.
Pasture yields over 3,000kg DM/Ha are likely to be declining in quality (less digestible) with increased stem and dead material and that certainly seems to be the case for the southern side of this property, as can be seen in the following images below.
RNDVI and Pasture Quality
RDVI of all possible combinations of two wavelength combinations improved prediction of the variation in pasture quality components Roujean and Breon (1995) stressed the advantage of RDVI sensitivity to photosynthetically active radiation over NDVI and DVI. The correlation matrix plot of all possible RDVI combinations showed that the variation in the quality components CP, ash, DCAD, OMD and ME were predicted with reasonable correlation (r 2 – 0.60 to 0.80) in linear and non-linear validation models using the five best RDVI two-band combinations. (Pullanagari et al, 2012)
NDVI
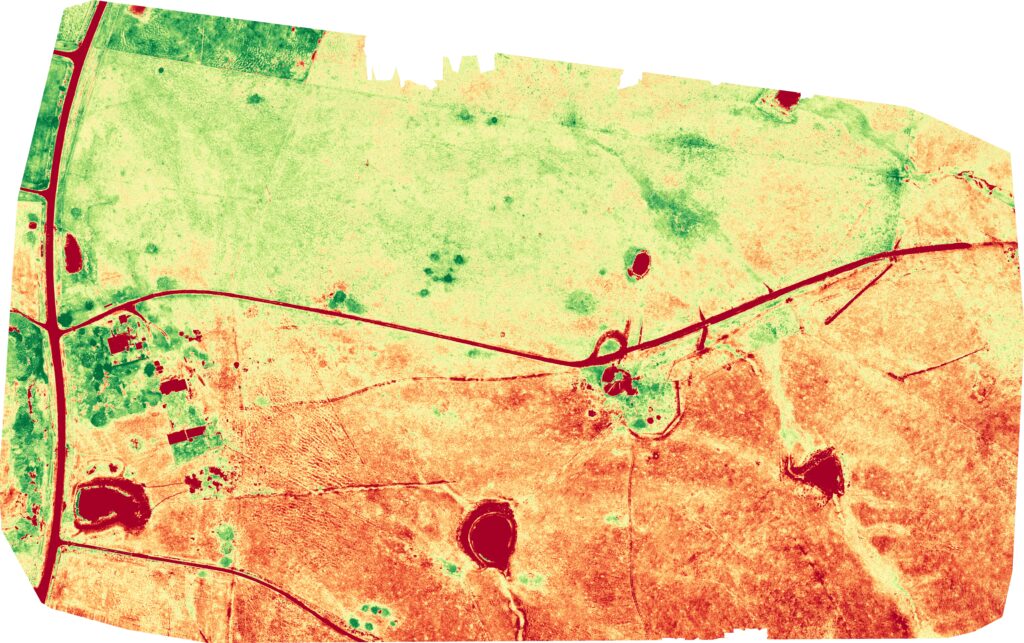
The index displayed is NDVI, (Normailed Differential Vegetation Idex) produced in Web ODM and displayed with a GRReN filter. The colour pallete is ReYlGr. The histogram displays NDVI values from 0.0 to 0.756. 0.0 values are deep red. 0.756 values are deep green. The range is from diseased or distressed plant to very healthy plant. In this instance the red area corresponds to higher ground. The green area to lower ground, suggesting that p[erhaps rainfall has benefitted the lower ground vegetation.
NDVI or greenness index is an indicator that shows the greenness, density and health of vegetation in each pixel of a satellite image. It has been one of the most widely used vegetation indices in remote sensing since its introduction in the 1970s, and digital agriculture is one of the industries that takes most advantage of it. Thus, this index is suitable for estimating vigor throughout the crop cycle based on how plants reflect certain ranges of the electromagnetic spectrum. It allows to know its current state, which can then be compared with another temporal image to observe its evolution over time.
NDRE
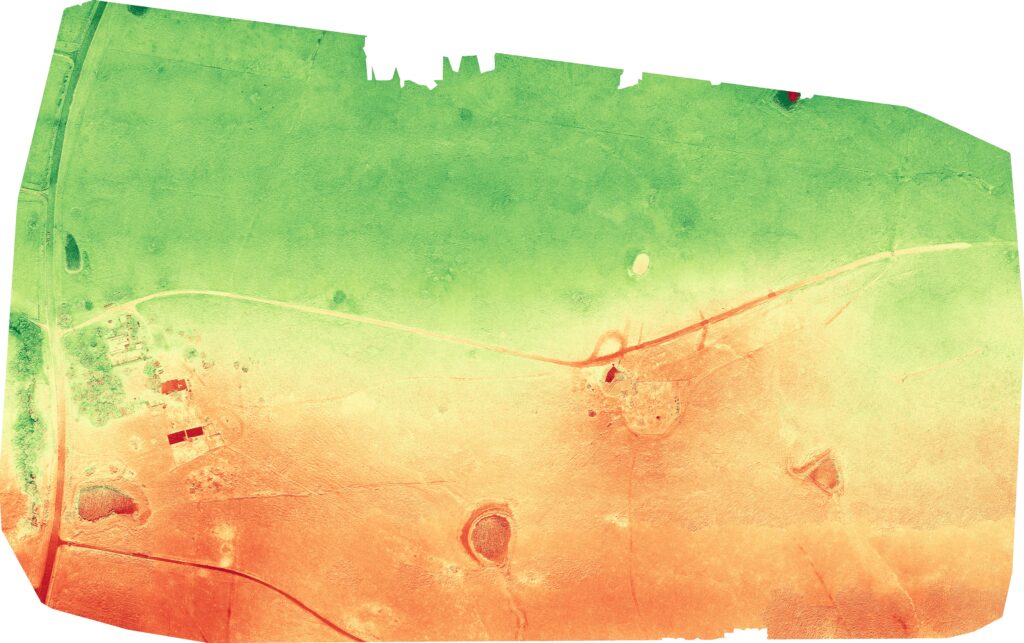
NDRE (Normalized Difference Red Edge) is an index very similar to NDVI. Its main difference lies in a safer solution, as it can detect variations in crop health at more advanced stages. This is because it uses red-edged light that can penetrate leaves much deeper than red light (used in NDVI). Thus, where there is more intense canopy it is advisable to use NDRE because NDVI saturates. This index detects changes in chlorophyll content, which is one of the main indicators of nitrogen inside the leaves. Values displayed are 0.316 to 07.32. It can be interpreted with the same chart above. Again you can see that the pasture on lower ground, north of the road is healthier.
We are presently developing methods using AI or Machine learning to identify weeds and to estimate pasture green biomass.
Skyspec Drone Services is pleased to provide this resource so that we may demonstrate our capabilities. Please do share with others.
References:
M. G. Trotter, D. W. Lamb, G. E. Donald, and D. A. Schneider. 2010. “Evaluating an active optical sensor for quantifying and mapping green herbage mass and growth in a perennial grass pasture.”, Crop and Pasture Science 61(5) 389-398 https://doi.org/10.1071/CP10019
